Information & Design
Designing for humans
Designing for humans

Download ‘printer-friendly’ PDF version (File size: 13 KB)
Many usability activities result in the production of large numbers of individual notations.
A formal method for dealing with this information provides several benefits:
Use this method whenever you have gathered a large number of notations (for example, contextual enquiry, walkthroughs and usability testing).
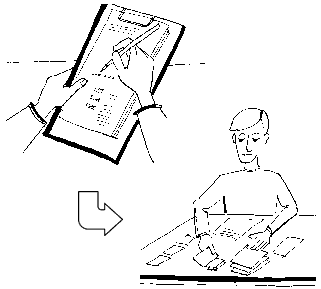
Use your preferred method to capture information – handwritten notes, or entries in a laptop or PDA. Focus on capturing the richest data set possible. If you are making handwritten notes, try to write legibly.
As soon as possible, enter your data in a table format. The precise format depends on the type of data you have collected, but in any case each notation should be uniquely identifiable. With contextual enquiry data, for example, each notation should include the participant number, the notation number, the notation type, and the actual notation.
For example:
| P no. | No. | Type | Notation |
|---|---|---|---|
| 1 | 1 | Trigger | Incoming phone call |
| 1 | 1 | "How can I help you?" |
Keep the notations as brief as possible. The ‘Type’ entry is optional. For usability testing or walkthroughs, include the task number also.
Use automatic numbering where possible to make the process more efficient (in the example, the numbers in the second column can be generated automatically).
When you have entered all notations, combine them into a single table. This provides the ability to sort in any way (such as by participant, or by type). It also enables you to search the complete data set (for example, how many notations contained the word ‘printer’ or ‘interrupt’?).
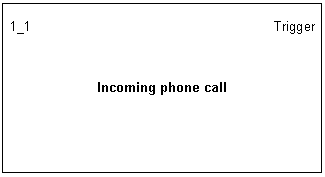
If the data set is small, you may be able to analyse it simply by reading, and you can manipulate the materials online to gain an understanding of them. If you have more than two or three pages of notations it becomes more difficult to do this. In such cases, use a word processor to create labels. For example:

Note that the number at the top left (participant number_notation number) is unique.
Print the labels on standard paper and then cut or guillotine them to size. You can then use affinity diagramming techniques to analyse the data, grouping related items.
For extremely large data sets, it may be appropriate to colour-code your notations (for example, to highlight issues or triggers).
More information and sample files are provided in ‘The InfoDesign Toolkit – Do-It-Yourself Usability Techniques’ (ISBN: 0-646-40950-6).